Hot Tip: Tracking COVID-19 With Analytics
How is the current COVID-19 coronavirus pandemic affecting your organization?You can use the Month to Date (Summary & Trend)*, Production Trend, and Transaction Trend views in Analytics
to determine the impact of COVID-19 on your revenue cycle and financial operations.
*Note: The availability and refresh frequency of the Month To Date module in your Analytics dataset depends on how your
organization is contracted with athenahealth.
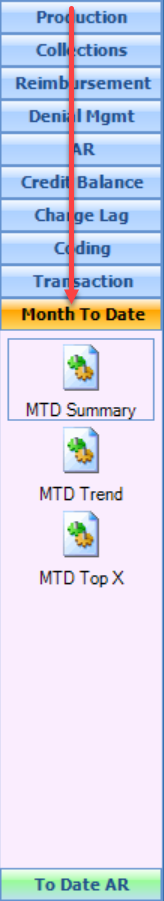
- Since the impact of this virus is relatively new, the first place to look is the Month To Date Views. This is where the visual nature of Analytics is especially useful. The intramonth
views (as they are sometimes called since the data is refreshed daily or weekly) are designed to give you a visual comparison of metrics in a defined timeframe,and defaults to
comparing the current month to date to an average for the prior three months. Because of the immediacy of the COVID-19 pandemic, select Prior Month in the comparison
drop down rather than three-month average, because you want to see if it has had an immediate and dramatic effect compared to the most recent month.
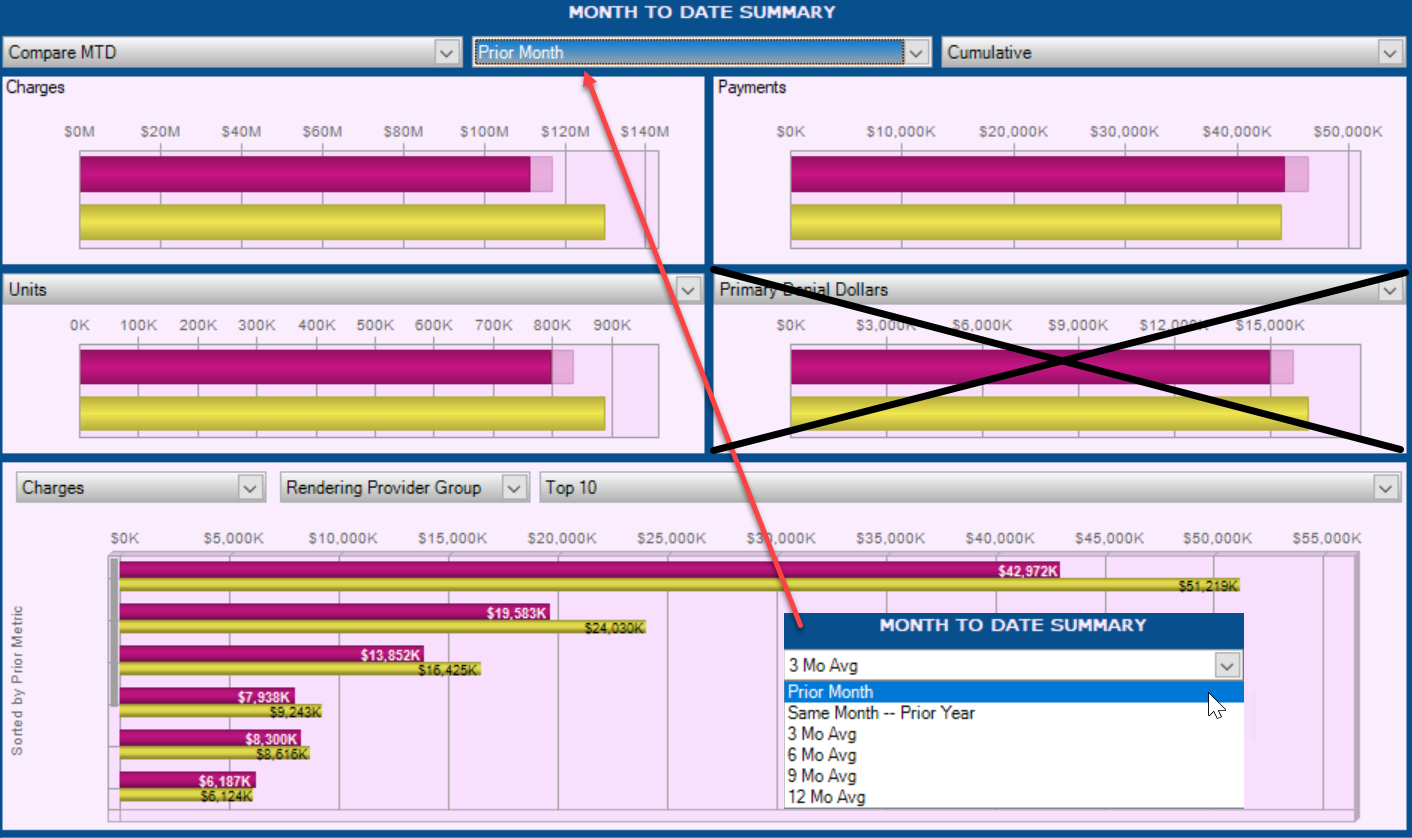
- Starting with the top 4 widgets in the MTD Summary view, you’ll be able to see, as of last night’s (or week’s) close, if there has been a dramatic decrease in your
primary metrics: Charges, Visits, or Payments (denials are not relevant at this time); and
- In the slicer, you can look at charges by provider group (or any other non-metric dimension in the filter list) to quickly identify any dramatic effects of the virus.*
*Dimension labels vary by pm system.
In the top view widgets, the magenta bar is the current month’s data thru last night’s (or week’s) close and the yellow bar is the comparison data through the same business
day (or week) of the prior month.The dark portion is the actual and the transparent portion is the predicted run rate at current averages.
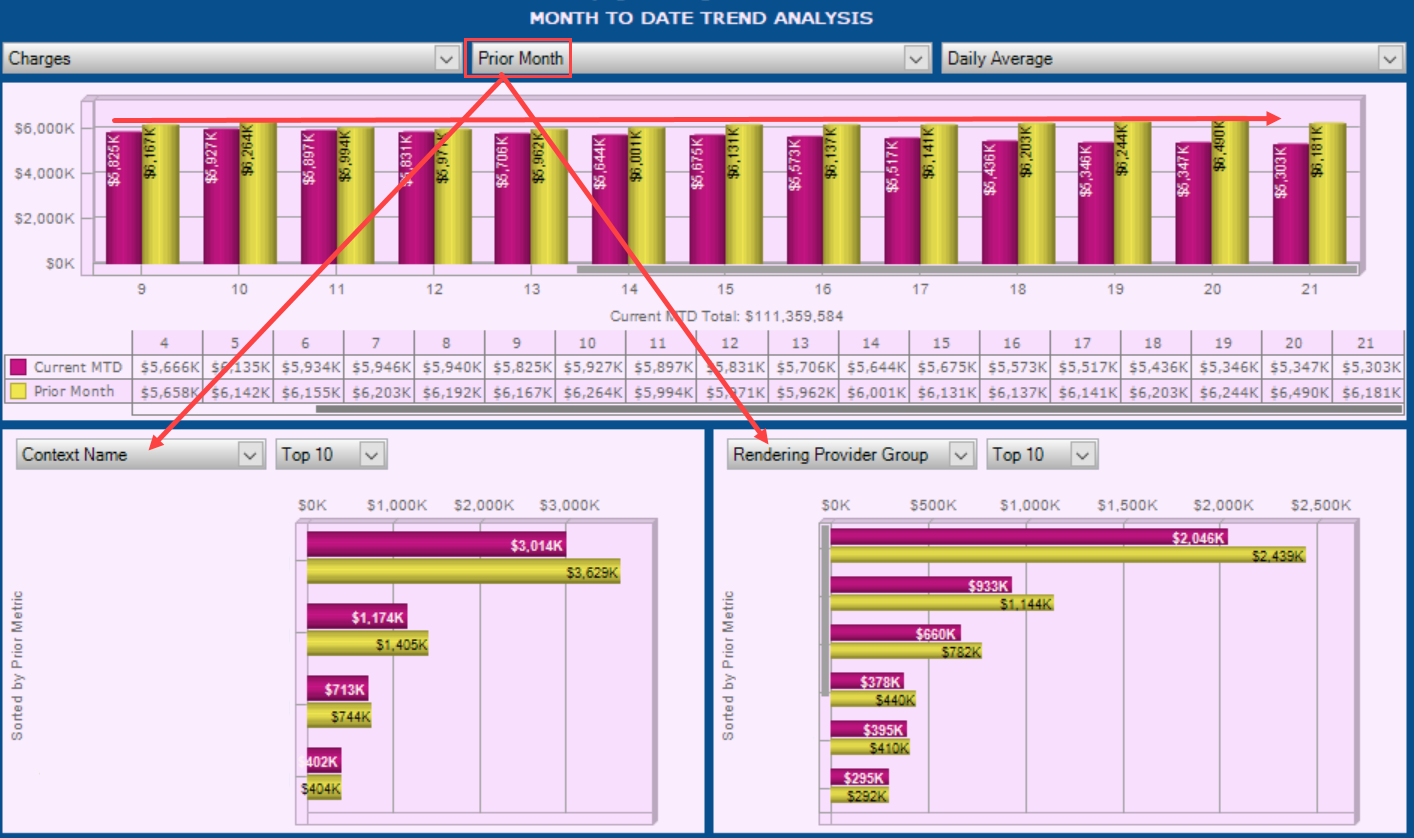
Next, move down to the MTD Trend view for a more granular detail of the pandemic’s possible impact. In this view, you can compare daily charges in the current month
to daily charges in the prior month - day one to day one, day two to day two and so on.
- As you transition to your next monthly refresh, continue to use the Month To Date views comparison features to track when/if you begin to see the expected decline
in productivity followed by the reduction in collections. There will be anywhere from a one to three-week lag between the drop in production metrics (visits and charges)
and the commensurate drop off in payments.
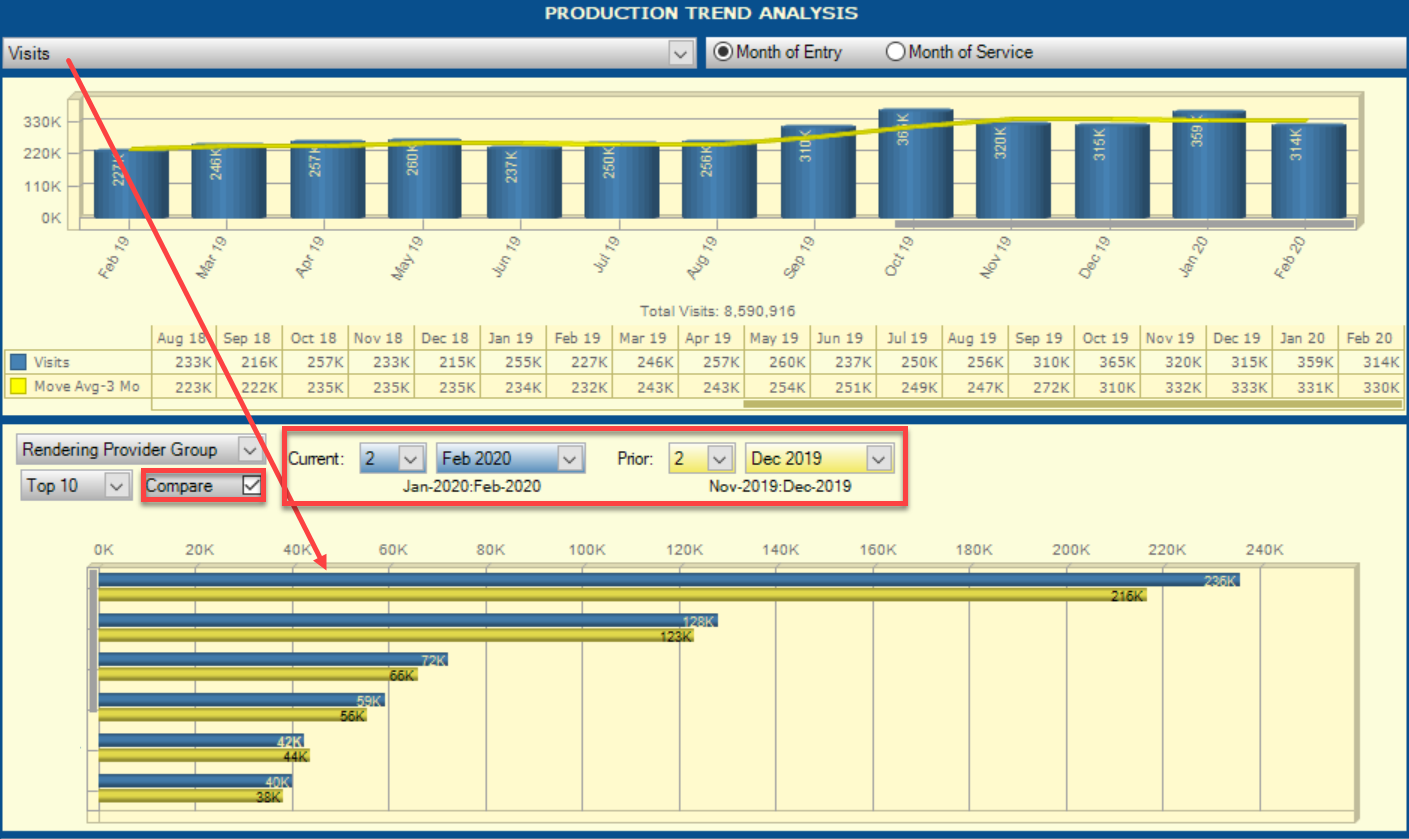
- After the end of the month, begin to track the productivity metrics in the Production view using the comparison feature to compare your visits production of the current
two months with the visits production of the prior two months. As you move forward, add a new month after each month so you can compare current three to prior
three, then four, and so on.
- And use the exact same method to track monthly changes in your collections using the Transaction Trend view.
For additional questions, please contact the Analytics CSC
(
coordinatorhelp@athenahealth.com) for further assistance.